Learn Statistics Hypothesis Testing a Proportion
Testing a hypothesis about a population proportion involves determining whether a sample proportion differs significantly from a hypothesized population proportion. Here's a detailed guide to hypothesis testing for a proportion:
Steps for Hypothesis Testing a Proportion
Formulate Hypotheses:
- Null Hypothesis (H₀): 𝑝 = 𝑝 0 p=p 0
- The population proportion is equal to the hypothesized proportion.
- Alternative Hypothesis (H₁): 𝑝 ≠ 𝑝 0 p =p 0 or 𝑝 > 𝑝 0 p>p 0 or 𝑝 < 𝑝 0 p< p 0
- The population proportion is not equal to, greater than, or less than the hypothesized proportion (depending on the test type).
Choose a Significance Level (α):
- Common values are 0.05, 0.01, or 0.10.
Select the Appropriate Test:
- Use the z-test for proportions.
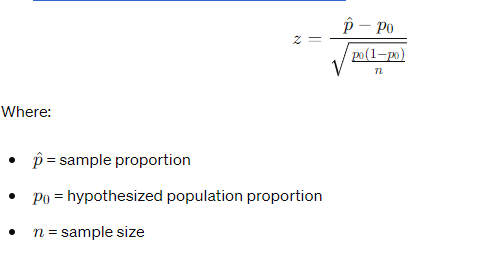
Calculate the Test Statistic:
- Use the sample data to calculate the z-score.
Determine the p-value:
- The p-value is the probability of obtaining a test statistic at least as extreme as the one observed, given that the null hypothesis is true.
Compare p-value with α:
- If p-value ≤ α, reject H₀.
- If p-value > α, do not reject H₀.
Draw a Conclusion:

-
Based on the comparison, conclude whether or not there is enough evidence to support the alternative hypothesis.
Example
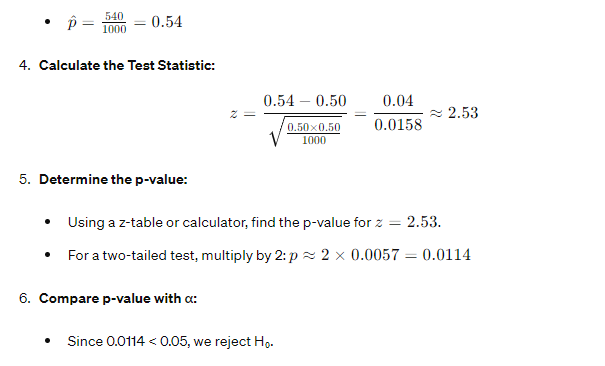
Suppose we want to test if the proportion of people who support a new policy is different from 50%. We collect a random sample of 1000 people and find that 540 support the policy.
Formulate Hypotheses:
- H₀: 𝑝 = 0.50 p=0.50
- H₁: 𝑝 ≠ 0.50 p =0.50 (two-tailed test)
Significance Level:
- α = 0.05
Sample Proportion:
Conclusion:
- There is significant evidence to conclude that the proportion of people who support the new policy is different from 50%.

Visual Representation
Here's an image illustrating this hypothesis test:
In the image:
- The blue curve represents the sampling distribution of the sample proportion under the null hypothesis.
- The red areas represent the rejection regions for a two-tailed test at α = 0.05.
- The vertical line represents the calculated z-value, showing it falls in the rejection region.
Advertisement