Learn Statistics Range
The range is a measure of variation, which describes how spread out the data is.
Range
The range is the difference between the smallest and the largest value of the data.
Range is the simplest measure of variation.
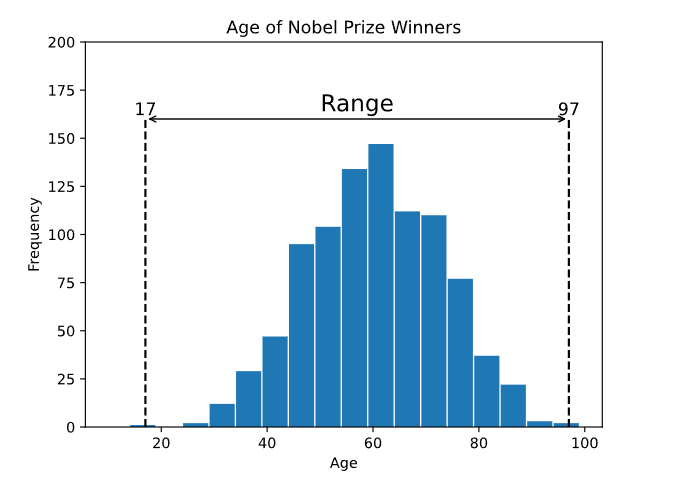
Here is a histogram of the age of all 934 Nobel Prize winners up to the year 2020, showing the range:

The youngest winner was 17 years and the oldest was 97 years. The range of ages for Nobel Prize winners is then 80 years.
Calculating the Range
The range can only be calculated for numerical data.
First, find the smallest and largest values of this example:
Calculate the difference by subtracting the smallest from the largest:
72 - 13 = 59
Calculating the Range with Programming
The range can easily be found with many programming languages.
Using software and programming to calculate statistics is more common for bigger sets of data, as finding it manually becomes difficult.
Example
With Python use the NumPy library ptp() method to find the range of the values 13, 21, 21, 40, 48, 55, 72:
import numpy
values = [13,21,21,40,48,55,72]
x = numpy.ptp(values)
print(x)
Example
Use the R min() and max() functions to find the range of the values 13, 21, 21, 40, 48, 55, 72:
values <- c(13,21,21,40,48,55,72)
max(values) - min(values)
Note: The range() function in R returns the smallest and largest values.